Smart City: monitor your city assets and optimise public services
In cities, parks, streets, malls, airports, and public buildings you are responsible to maintain all your public assets and optimise services towards your citizens or visitors. Whether managing traffic and mobility solutions, keeping track of air quality, or even managing trees, doing it in a cost effective manner is key. The OpenRemote open source IoT platform for Smart Cities adds value by combining live data, connecting the dots to generate valuable information and predictions. This smart aggregation of integrated solutions and the predictions help you gain new insights into activity in your area of interest and optimise your services.
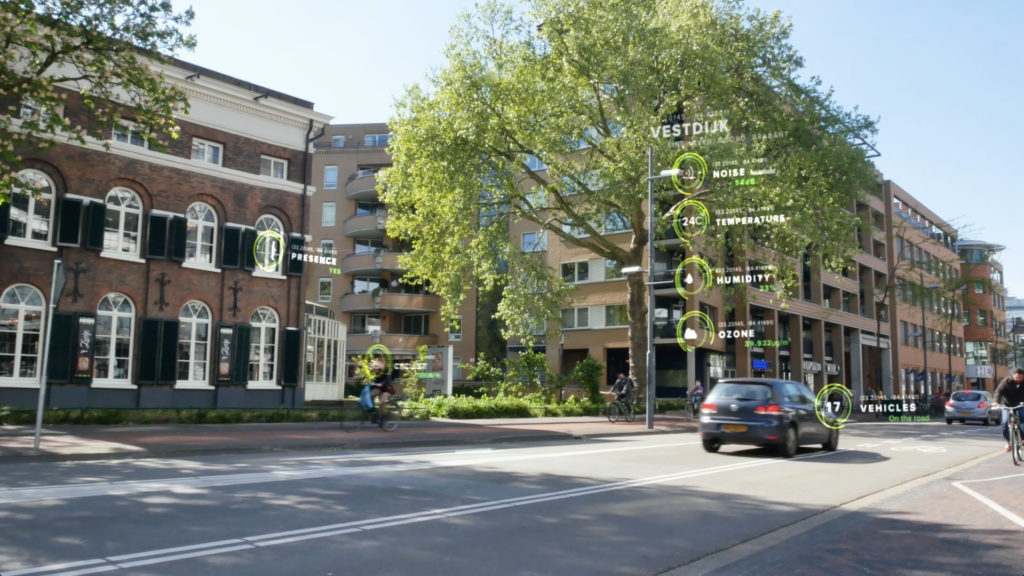
Integrate different solutions into one centralized platform
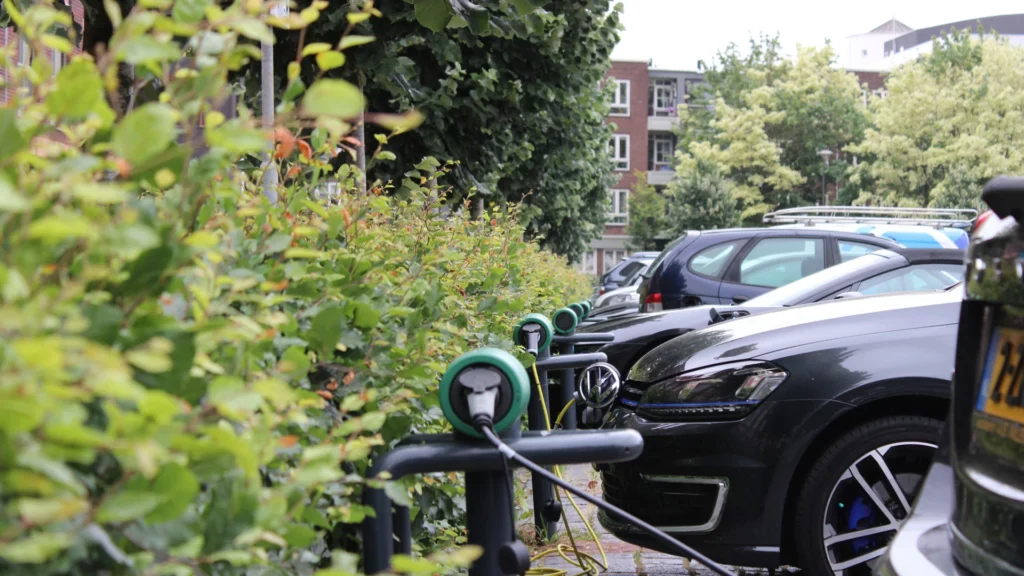
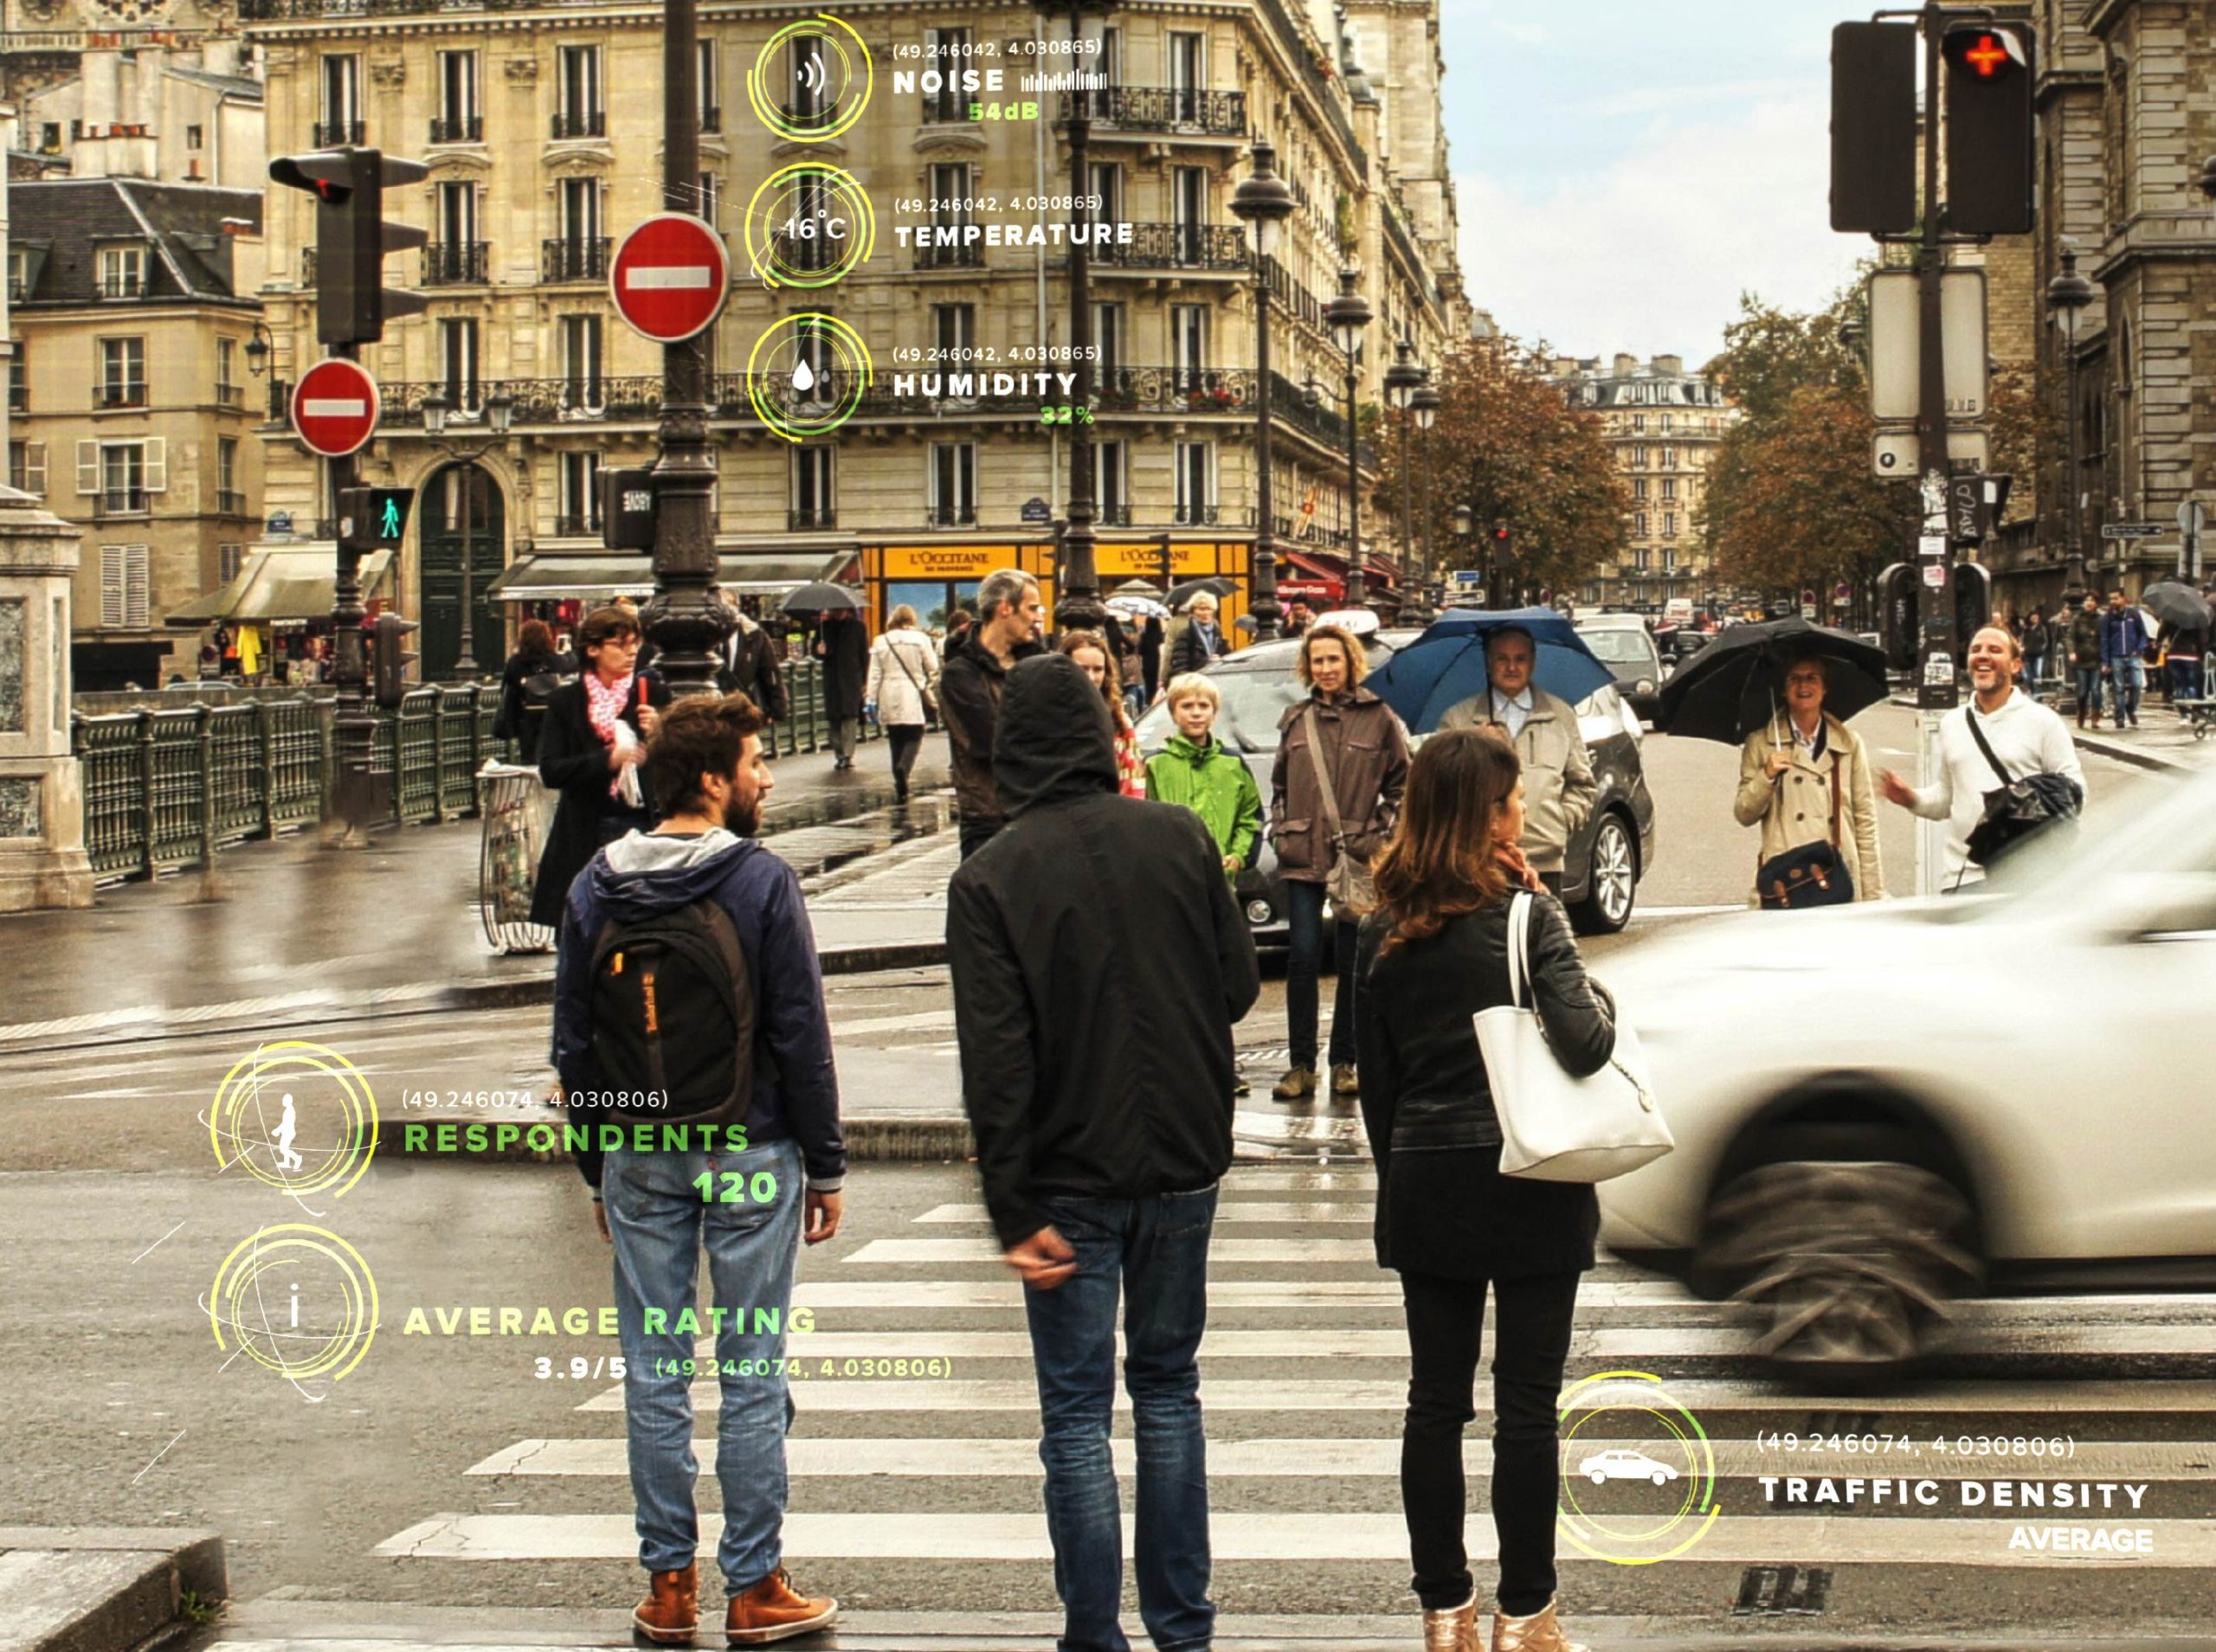
The biggest source of new information comes from the smart combination of existing sensors and devices. By integrating the devices of separate systems into one centralised platform, their data can be processed and combined. For example the values of a microphone and a people counter allows you to make the distinction between a busy, but calm morning, and a busy noisy crowd. Or monitoring soil humidity in combination with weather forecasts helps you in effectively maintaining and watering your greenery. And for mobility, keeping track of parking occupancy or the live tracking of shared mobility solutions, helps you optimising a strategy towards a sustainable city.
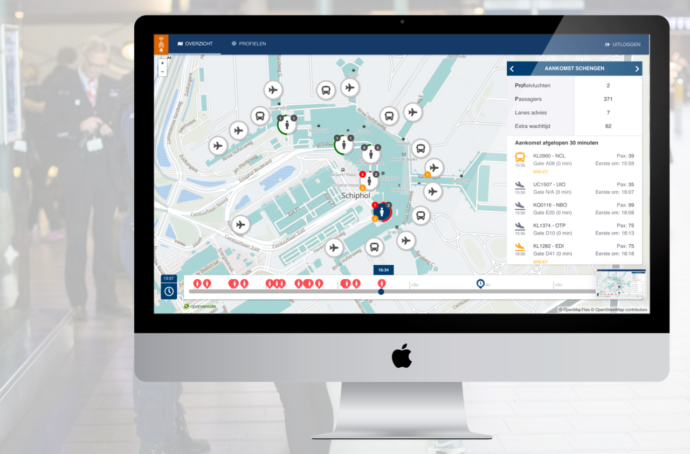
Predict traffic flows and define profiles
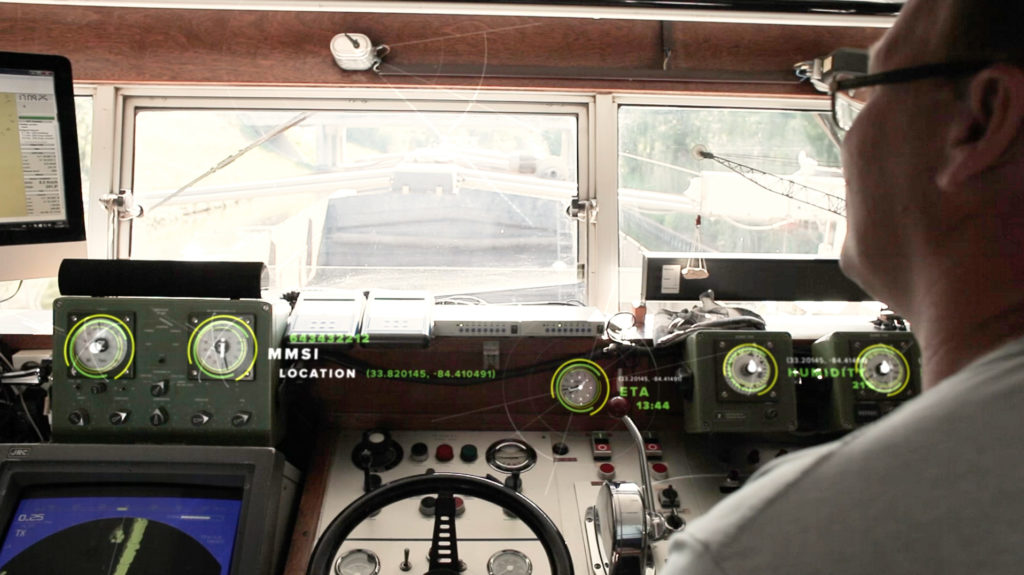
OpenRemote rules engine allows users to predict for any relevant application, for example traffic flows and bottlenecks. Knowing these ahead of time lets professionals anticipate and (automatically) act on upcoming congestion. For instance, expected delays in arrivals at an airport are predicted to translate into critical queue times at passport control one hour later. The system automatically sends a request to teamleads to move staff in an hour. This can be combined with profiles, defining additional conditions for a trigger. In the airport example, the origin, dominant language, or airline is relevant for defining the required staff capabilities.
Automated notifications to inform maintenance or surveillance
As maintenance or surveillance department you can easily set up alarms when certain threshold values are crossed. For example when a square during a national celebration gets too crowded or when an intersection is disproportionally busy compared to similar intersections. Or something completely different: list all those trees which need watering and feed these into your maintenance application using web-hooks. Together with using the mobile apps you can also send push notifications to users requesting them to take action.
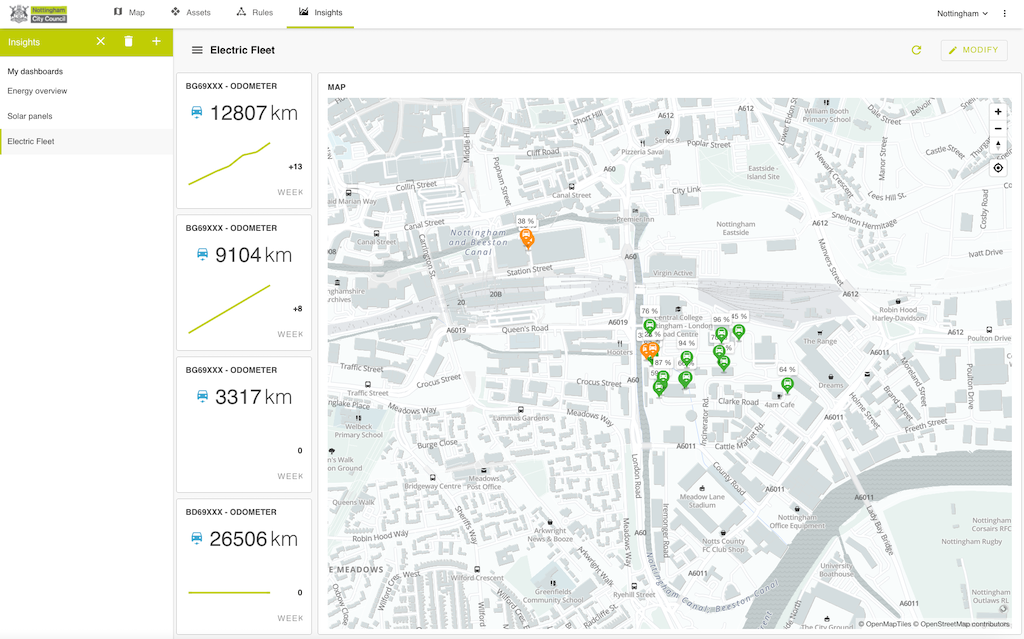
Dashboard apps to share and gain new insights
With all assets connected you can build your own dashboard apps with data visualisations, for example compare busy streets, areas, or hallways. Additionally, you can create separate map views or charts or maps for different users and share these as standalone applications with your departments or users. Using the public dashboards or web components you can even add these to your own city website.